Analyze learner engagement with the new, visual, Learning Path Statistics Report
1719901710692
We’ve just released the new Learning Path Statistics report to help our group leaders analyze learning path engagement, participation and completion over time.
This new report contains 3 types of graphs, each designed to highlight key pieces of information that help you better understand the effectiveness of your learning paths and security training.
Graph 1: Learning Path Course engagement
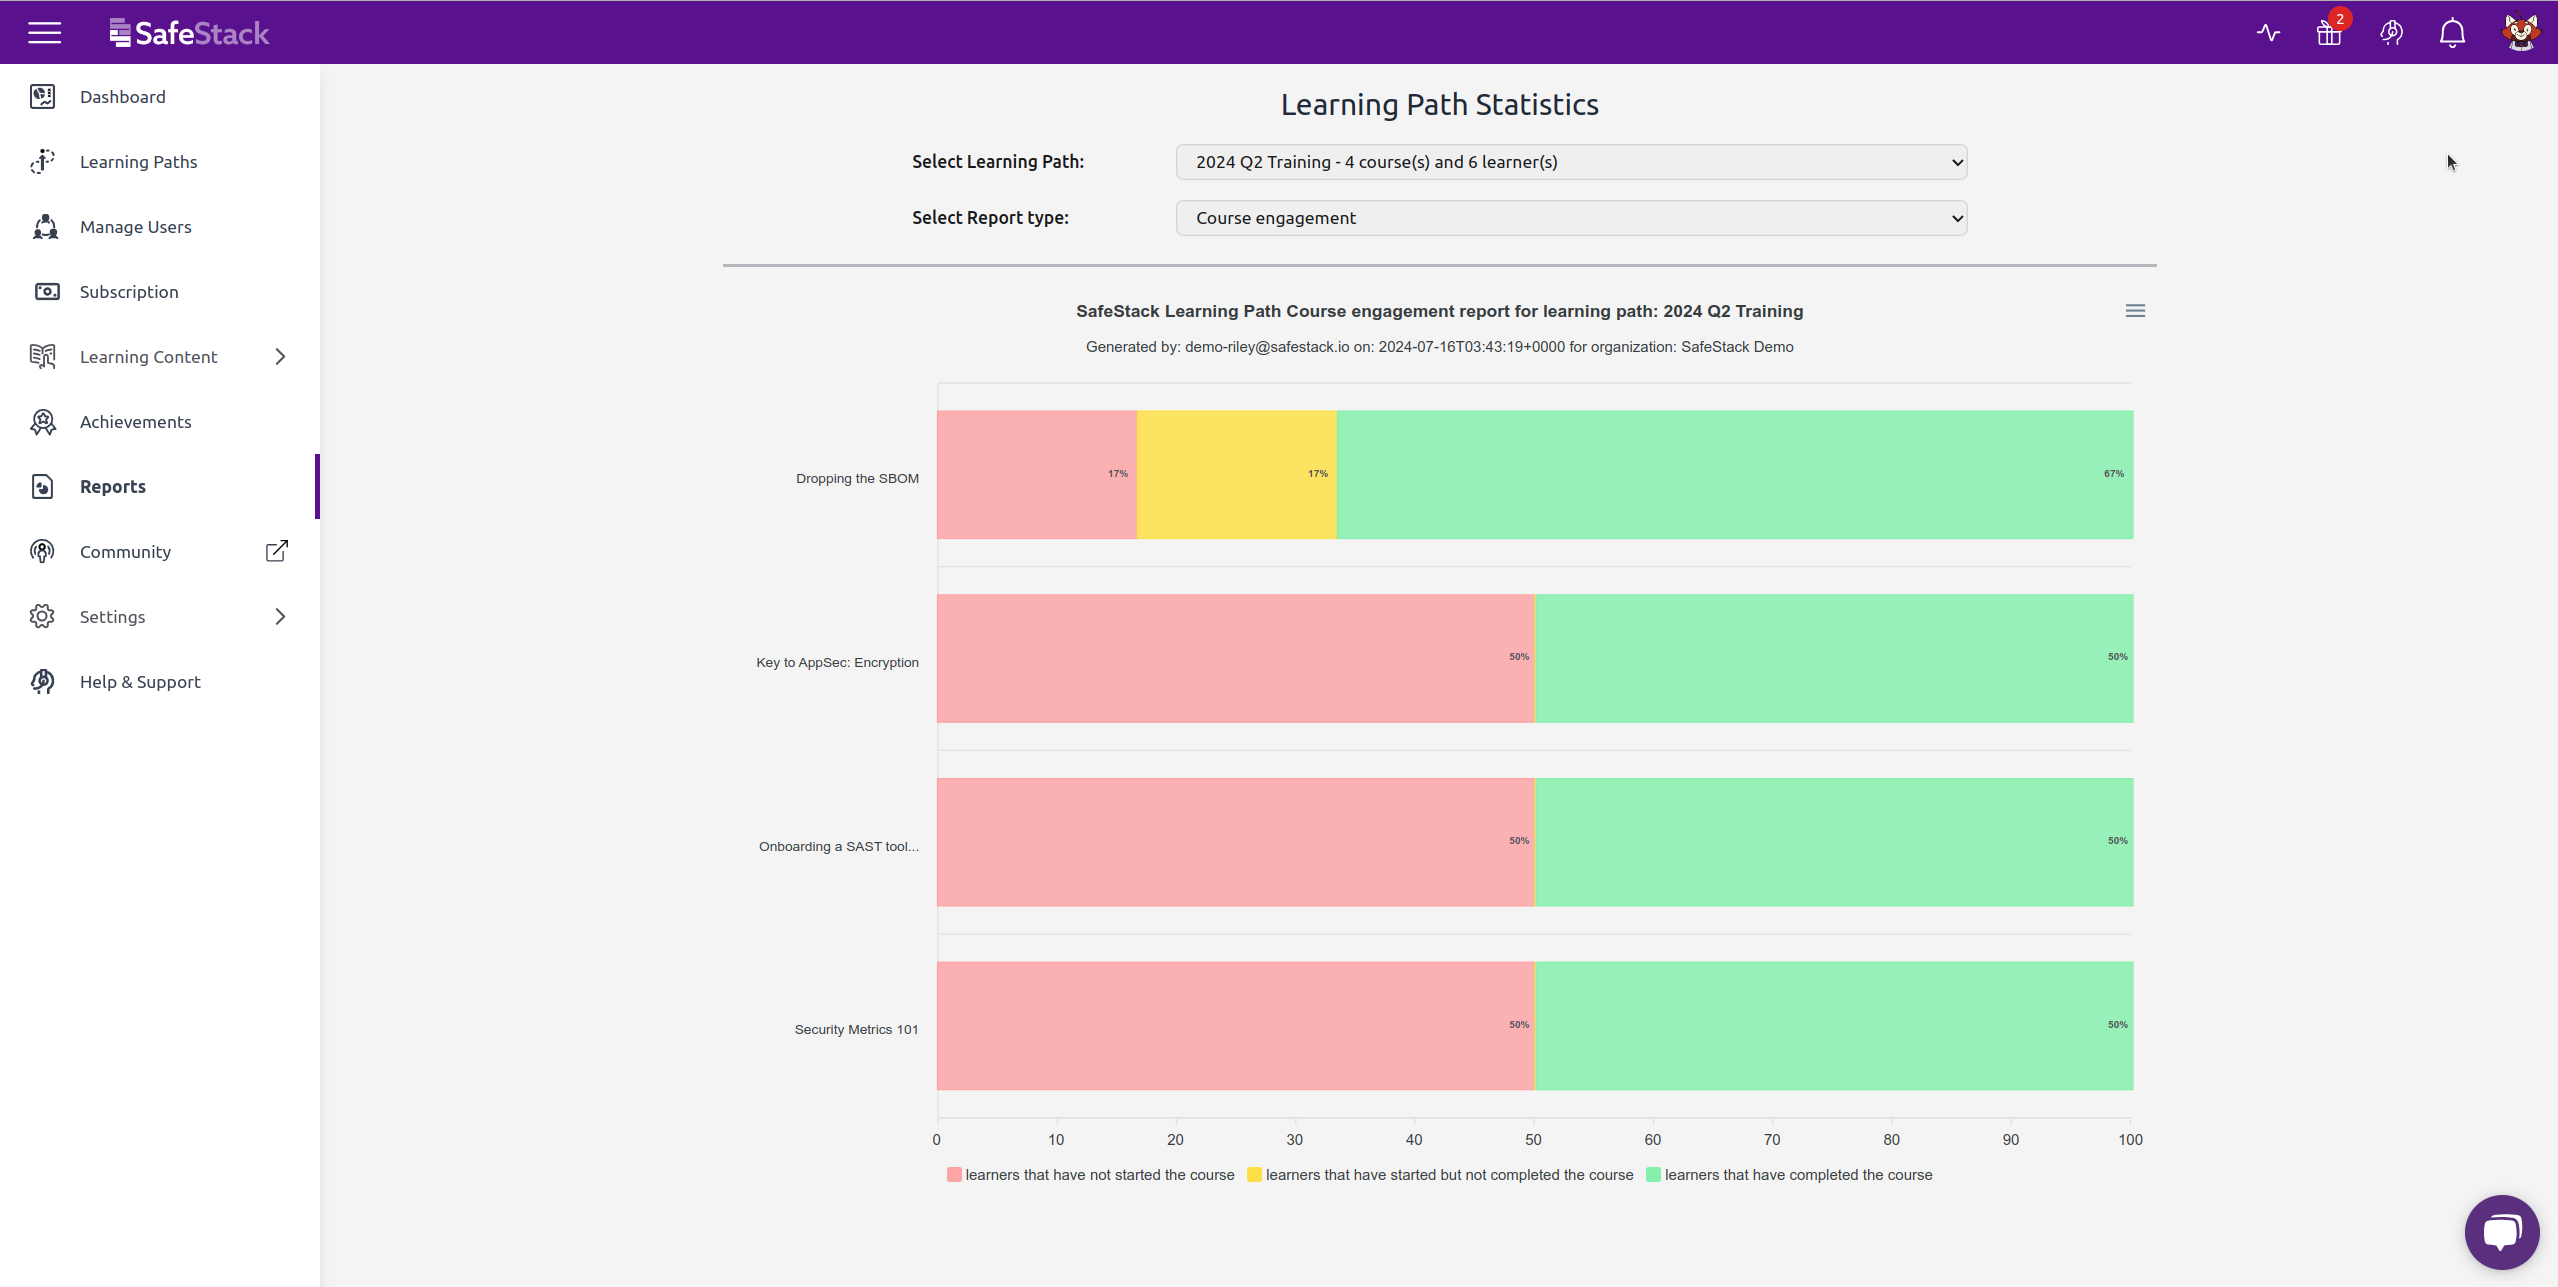
This graph highlights the engagement of your learning path at the course level. It can help answer questions like:
What courses are being fully completed by my learners?
What courses are being started but not completed by my learners?
What courses are not being started at all by my learners?
What courses are most engaging, and which ones are my learners not too interested in?
Graph 2: Learning Path Engagement
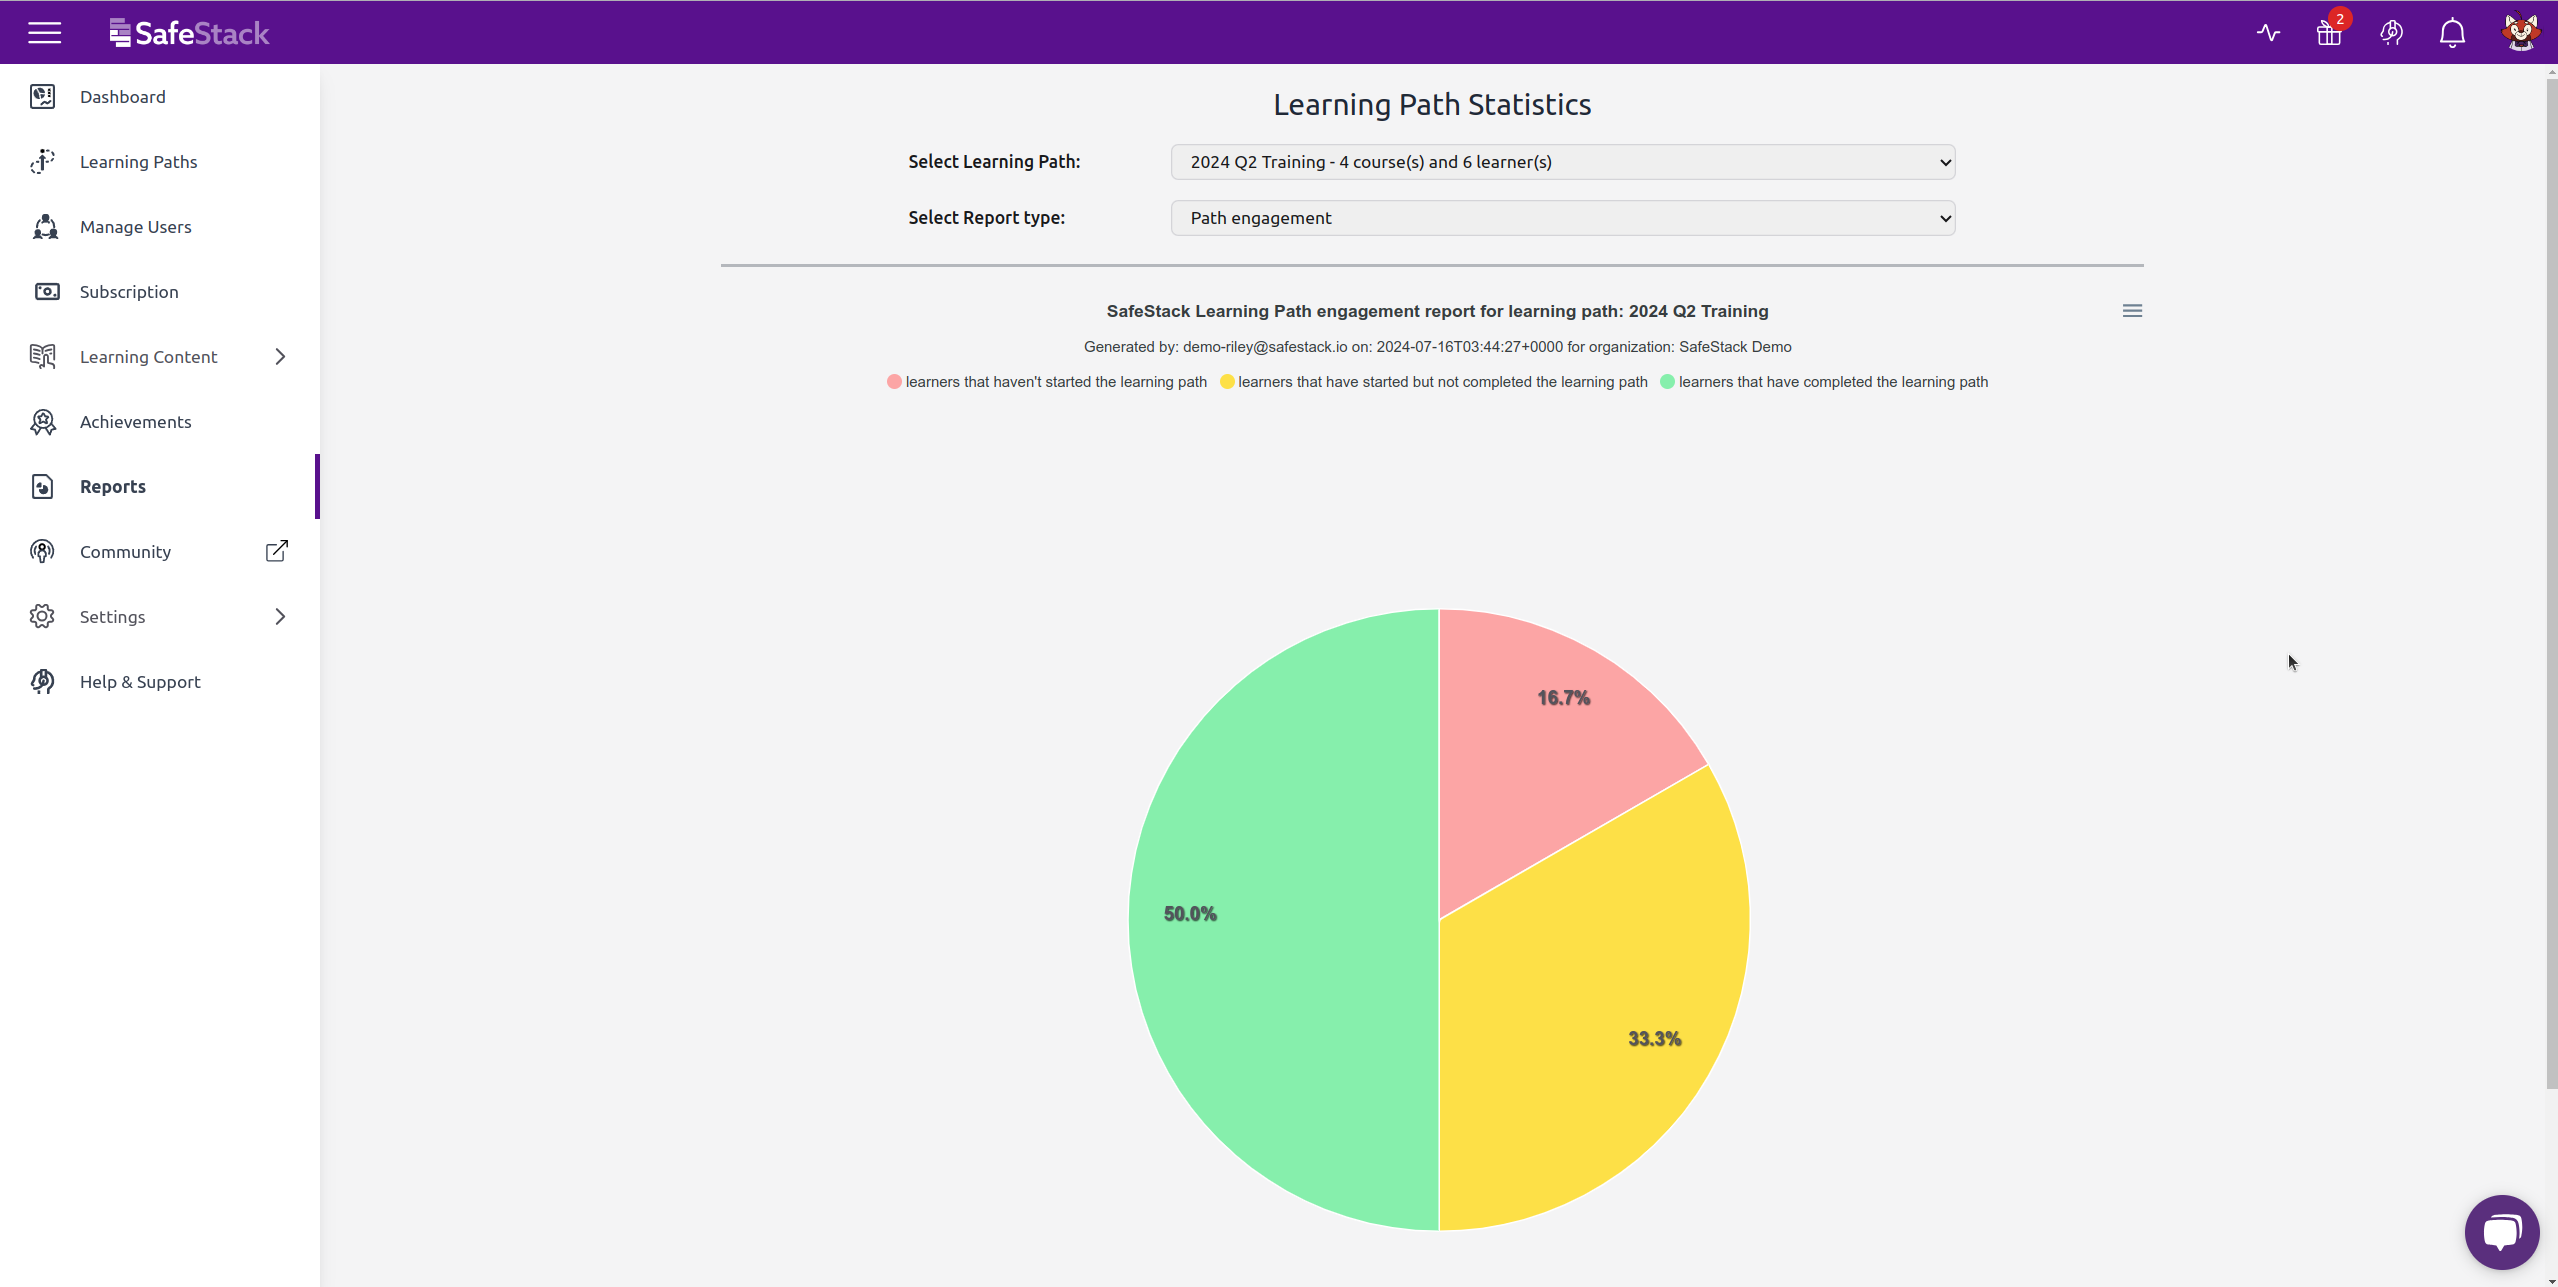
This pie chart compares the percentage of your learners that have not yet started, started and completed your learning path as a whole. This can help group leaders visualize learning path engagement easily. Over time, one would want the red slice to reduce in size and the green slice to increase in size.
Graph 3: Learning Path completion over time
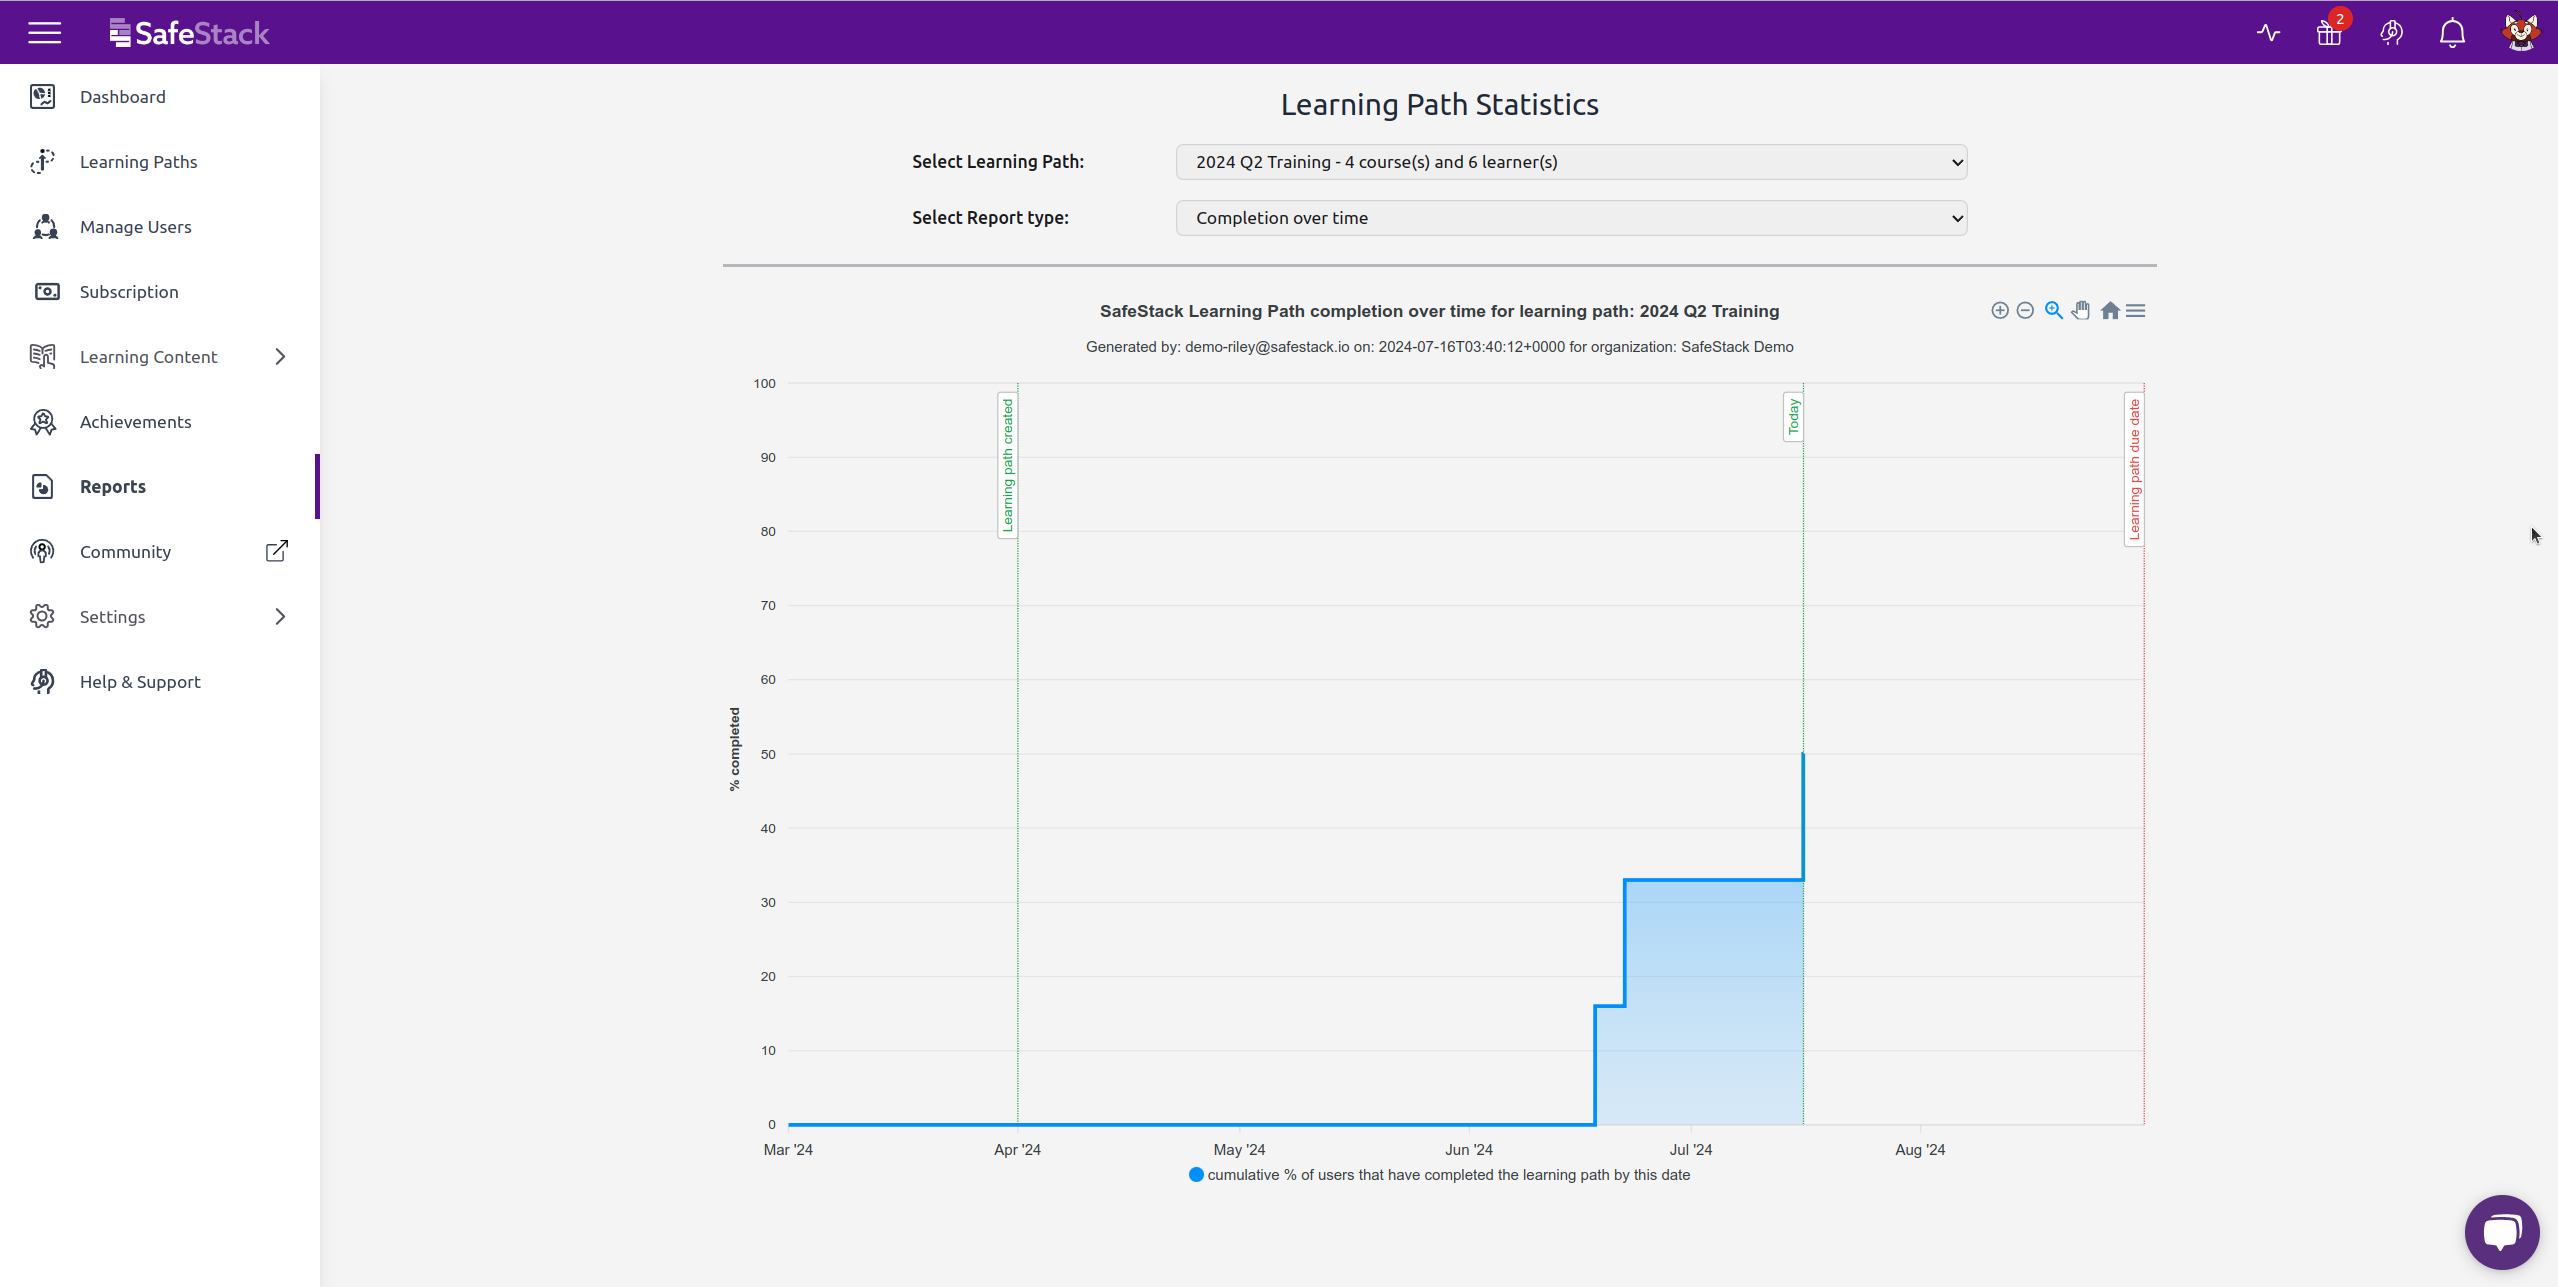
This graph plots the cumulative percentage of users that have completed the learning path, over time. This is really useful to understand how quickly your team is ramping up with their training and how much training there is still left to be done, before you hit the learning path due date (if there is one).
Other functionality
Graph toolbar
The graph toolbar (top right of every graph) can be used to download the graph in the PNG or SVG format. You can also download the raw data behind the graph, by downloading using the CSV format option.
For time series graphs (like the Learning Path completion over time graph), you can also zoom in/out or drag and select a specific time range you want to explore within the whole period.
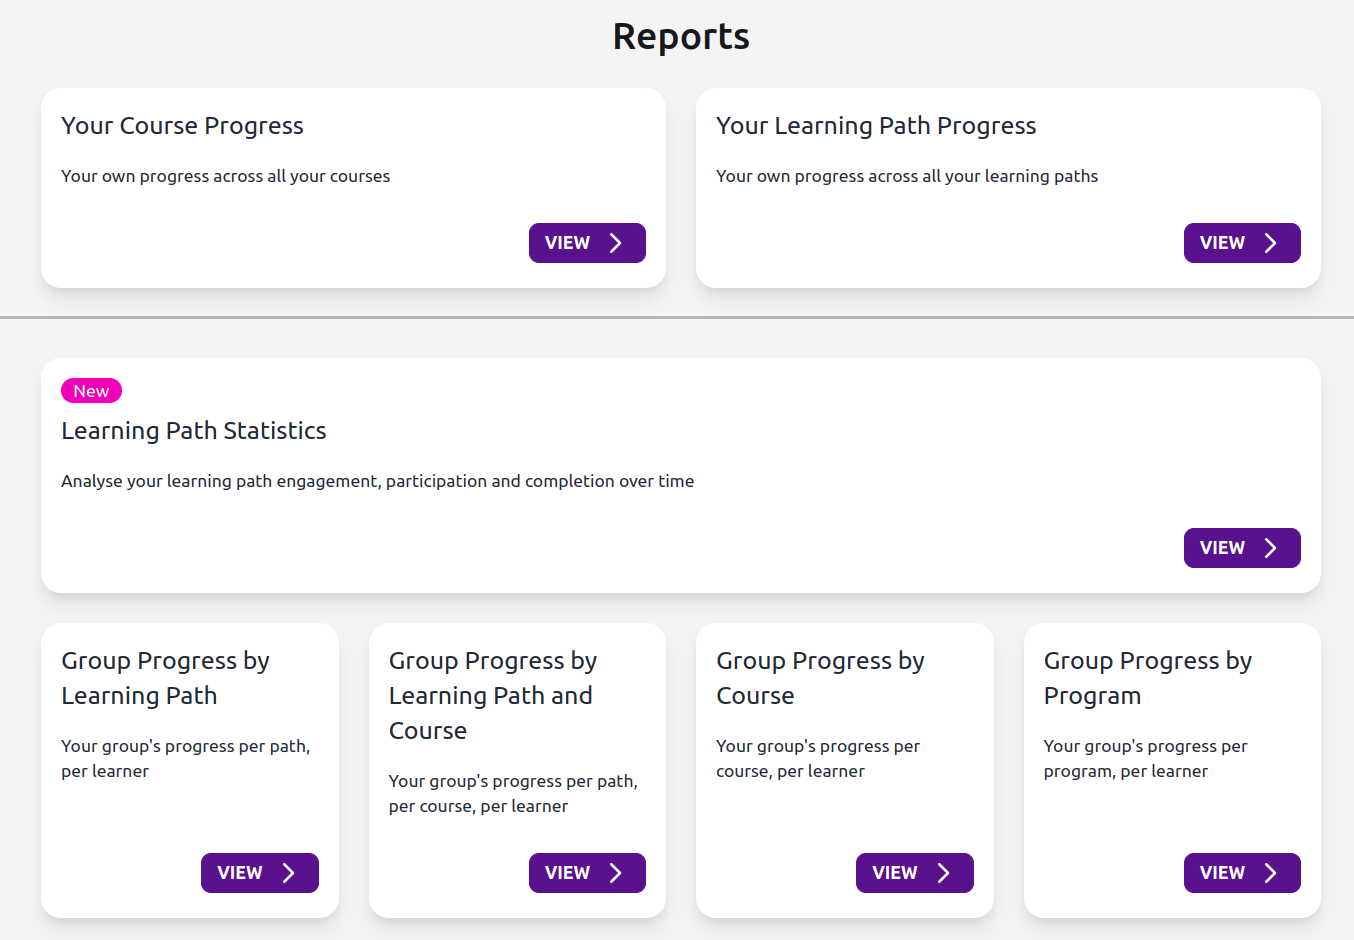
Reports page
We’ve made minor changes to the Reports page to separate individual reports from group reports much more clearly.
More interesting changes ahead
In the future, we plan to add more functionality to these reports to take them a step further, making it easy for group leaders to communicate with their learners about their training. But we will have more on that later!
We hope you enjoy the new changes in SafeStack and are always open to feedback, suggestions or concerns.