By breaking down our larger courses, we aim to support learners in achieving their goals without feeling overwhelmed, making their secure development training even more achievable!
What’s New?
Smaller Course Sizes: Our longer, content-heavy courses are now also available as much smaller, digestible courses. This means learners can absorb information in bite-sized pieces, reducing the pressure of completing extensive modules, all in one go.
Flexible Learning: With smaller courses
Learners can now spread their training over several weeks or months. This flexibility allows them to focus on one module at a time, ensuring better retention and a more manageable workload.
Group leaders can add more focused training modules in learning paths, making the learning paths much smaller, more achievable and better customised for your specific training needs.
Larger Courses Still Available: If you prefer the original format, don’t worry! The larger, comprehensive courses remain available for those who enjoy diving deep into a topic all at once.
Seamless Progress Tracking: As an added bonus, any progress made in the smaller modules will automatically carry over into the corresponding larger course (and the other way around). This ensures that no effort is lost, and learners can switch between formats without missing a beat. If you have already completed one of these modules in the original course, this completion will be carried over into the smaller course as well.
What courses are now available as smaller courses?
The Finding and Fixing Web Application Security Vulnerabilities course is about 4 hours and 33 minutes long. It contains 13 modules in total.
All its core modules (except for the introduction) are now available as individual courses:
Finding and Fixing: Operating System Injection Vulnerabilities
Finding and Fixing: Cross Site Scripting Vulnerabilities (XSS)
Finding and Fixing: Using Components with Known Vulnerabilities
Finding and Fixing: XML External Entity (XXE) Vulnerabilities
The Finding and Fixing API Security Vulnerabilities course is about 2 hours and 29 minutes long. It contains 10 modules in total.
All its core modules (except for the introduction) are now available as individual courses:
Finding and Fixing: Broken API Authentication Vulnerabilities
Finding and Fixing: Broken API Authorisation Vulnerabilities
Finding and Fixing: API Resource Limitations Vulnerabilities
Finding and Fixing: API Misconfiguration and Mismanagement Vulnerabilities
The Introduction to DevSecOps is about 3 hours and 19 minutes long. It contains 5 modules in total.
All its modules are now available as individual courses:
This update is all about giving you more control over your learning experience, while still offering the flexibility to choose the format that best suits your needs.
]]>This new report contains 3 types of graphs, each designed to highlight key pieces of information that help you better understand the effectiveness of your learning paths and security training.
Graph 1: Learning Path Course engagement
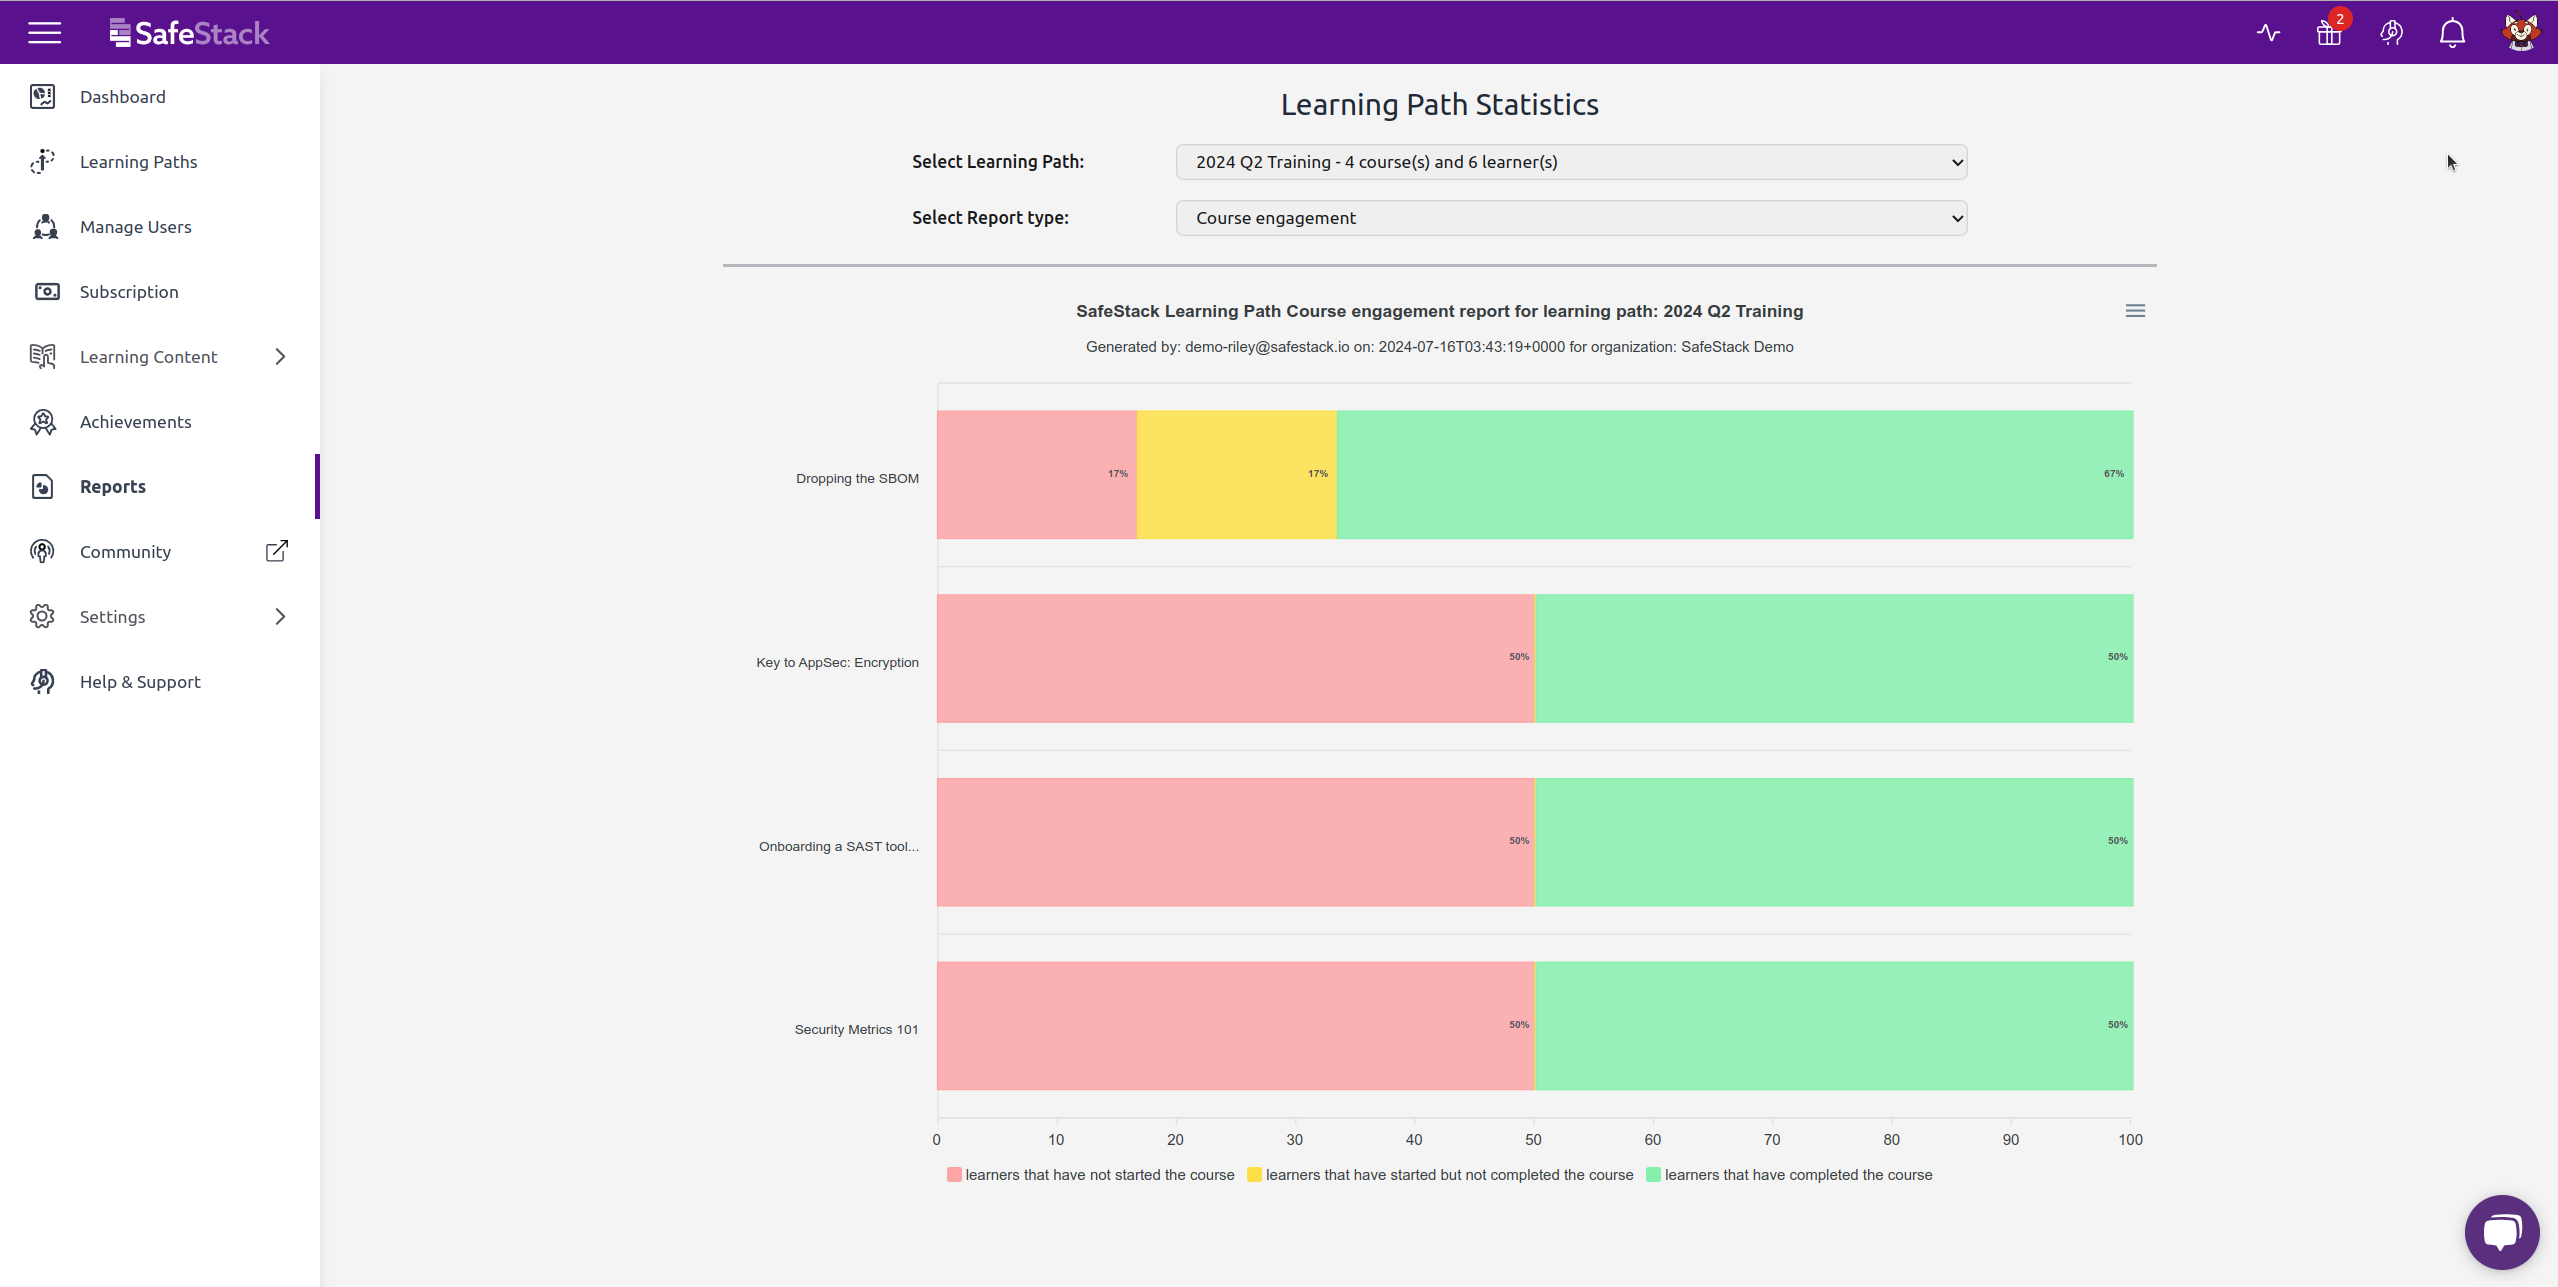
This graph highlights the engagement of your learning path at the course level. It can help answer questions like:
What courses are being fully completed by my learners?
What courses are being started but not completed by my learners?
What courses are not being started at all by my learners?
What courses are most engaging, and which ones are my learners not too interested in?
Graph 2: Learning Path Engagement
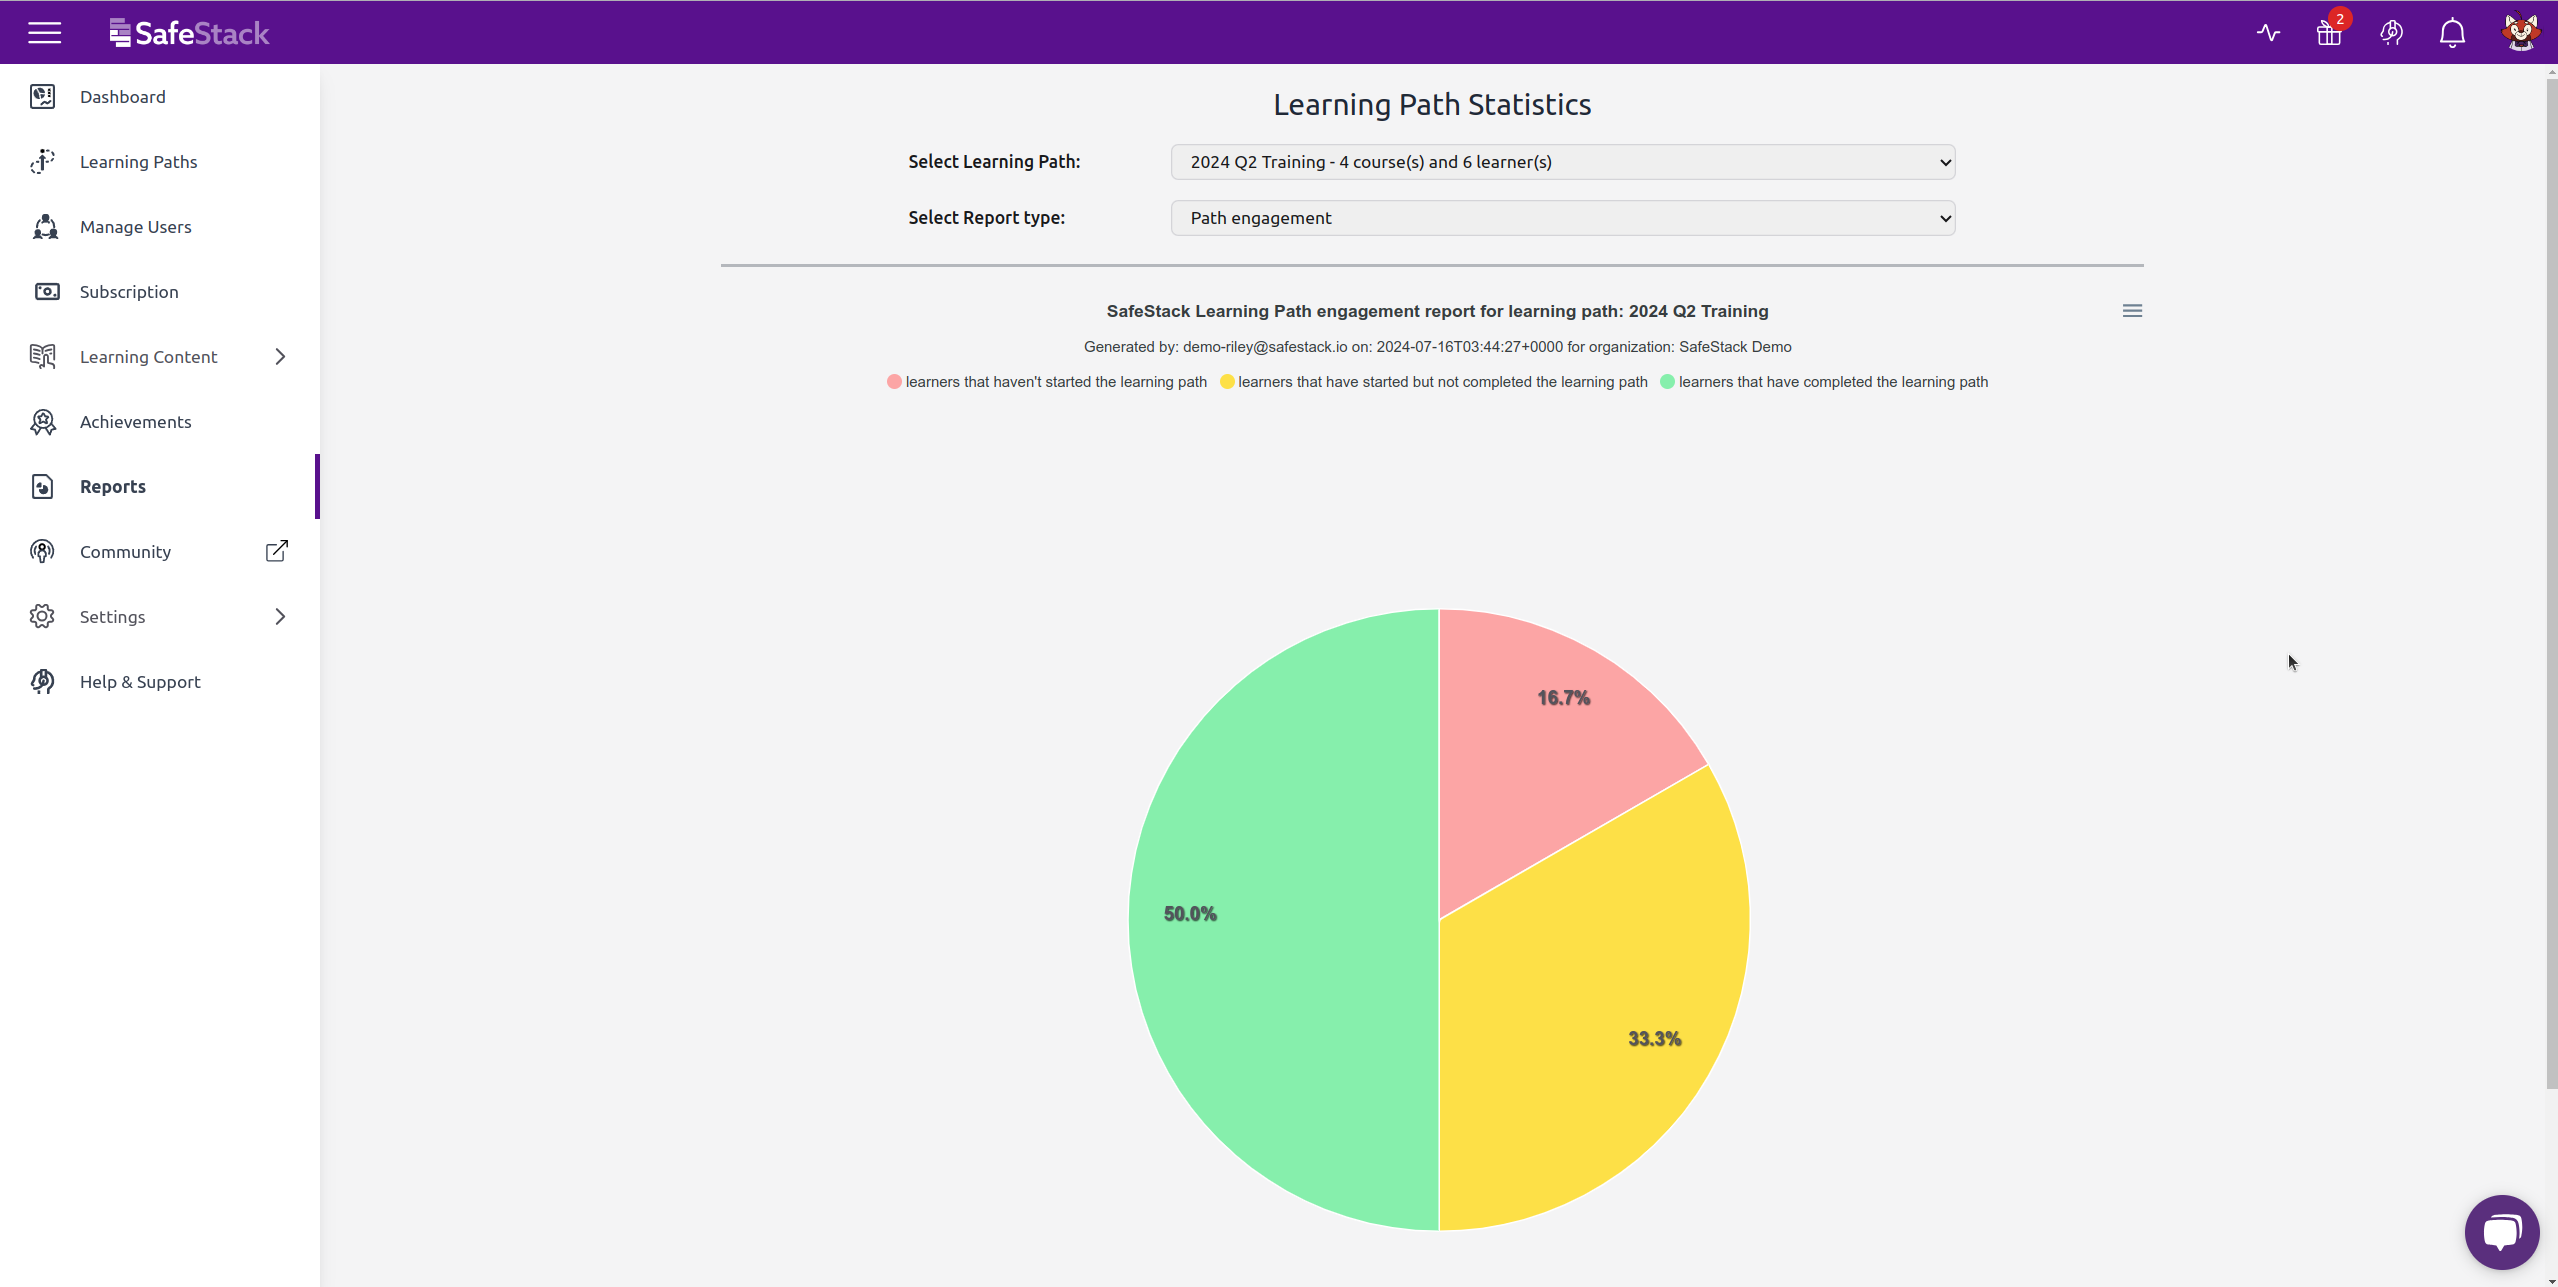
This pie chart compares the percentage of your learners that have not yet started, started and completed your learning path as a whole. This can help group leaders visualize learning path engagement easily. Over time, one would want the red slice to reduce in size and the green slice to increase in size.
Graph 3: Learning Path completion over time
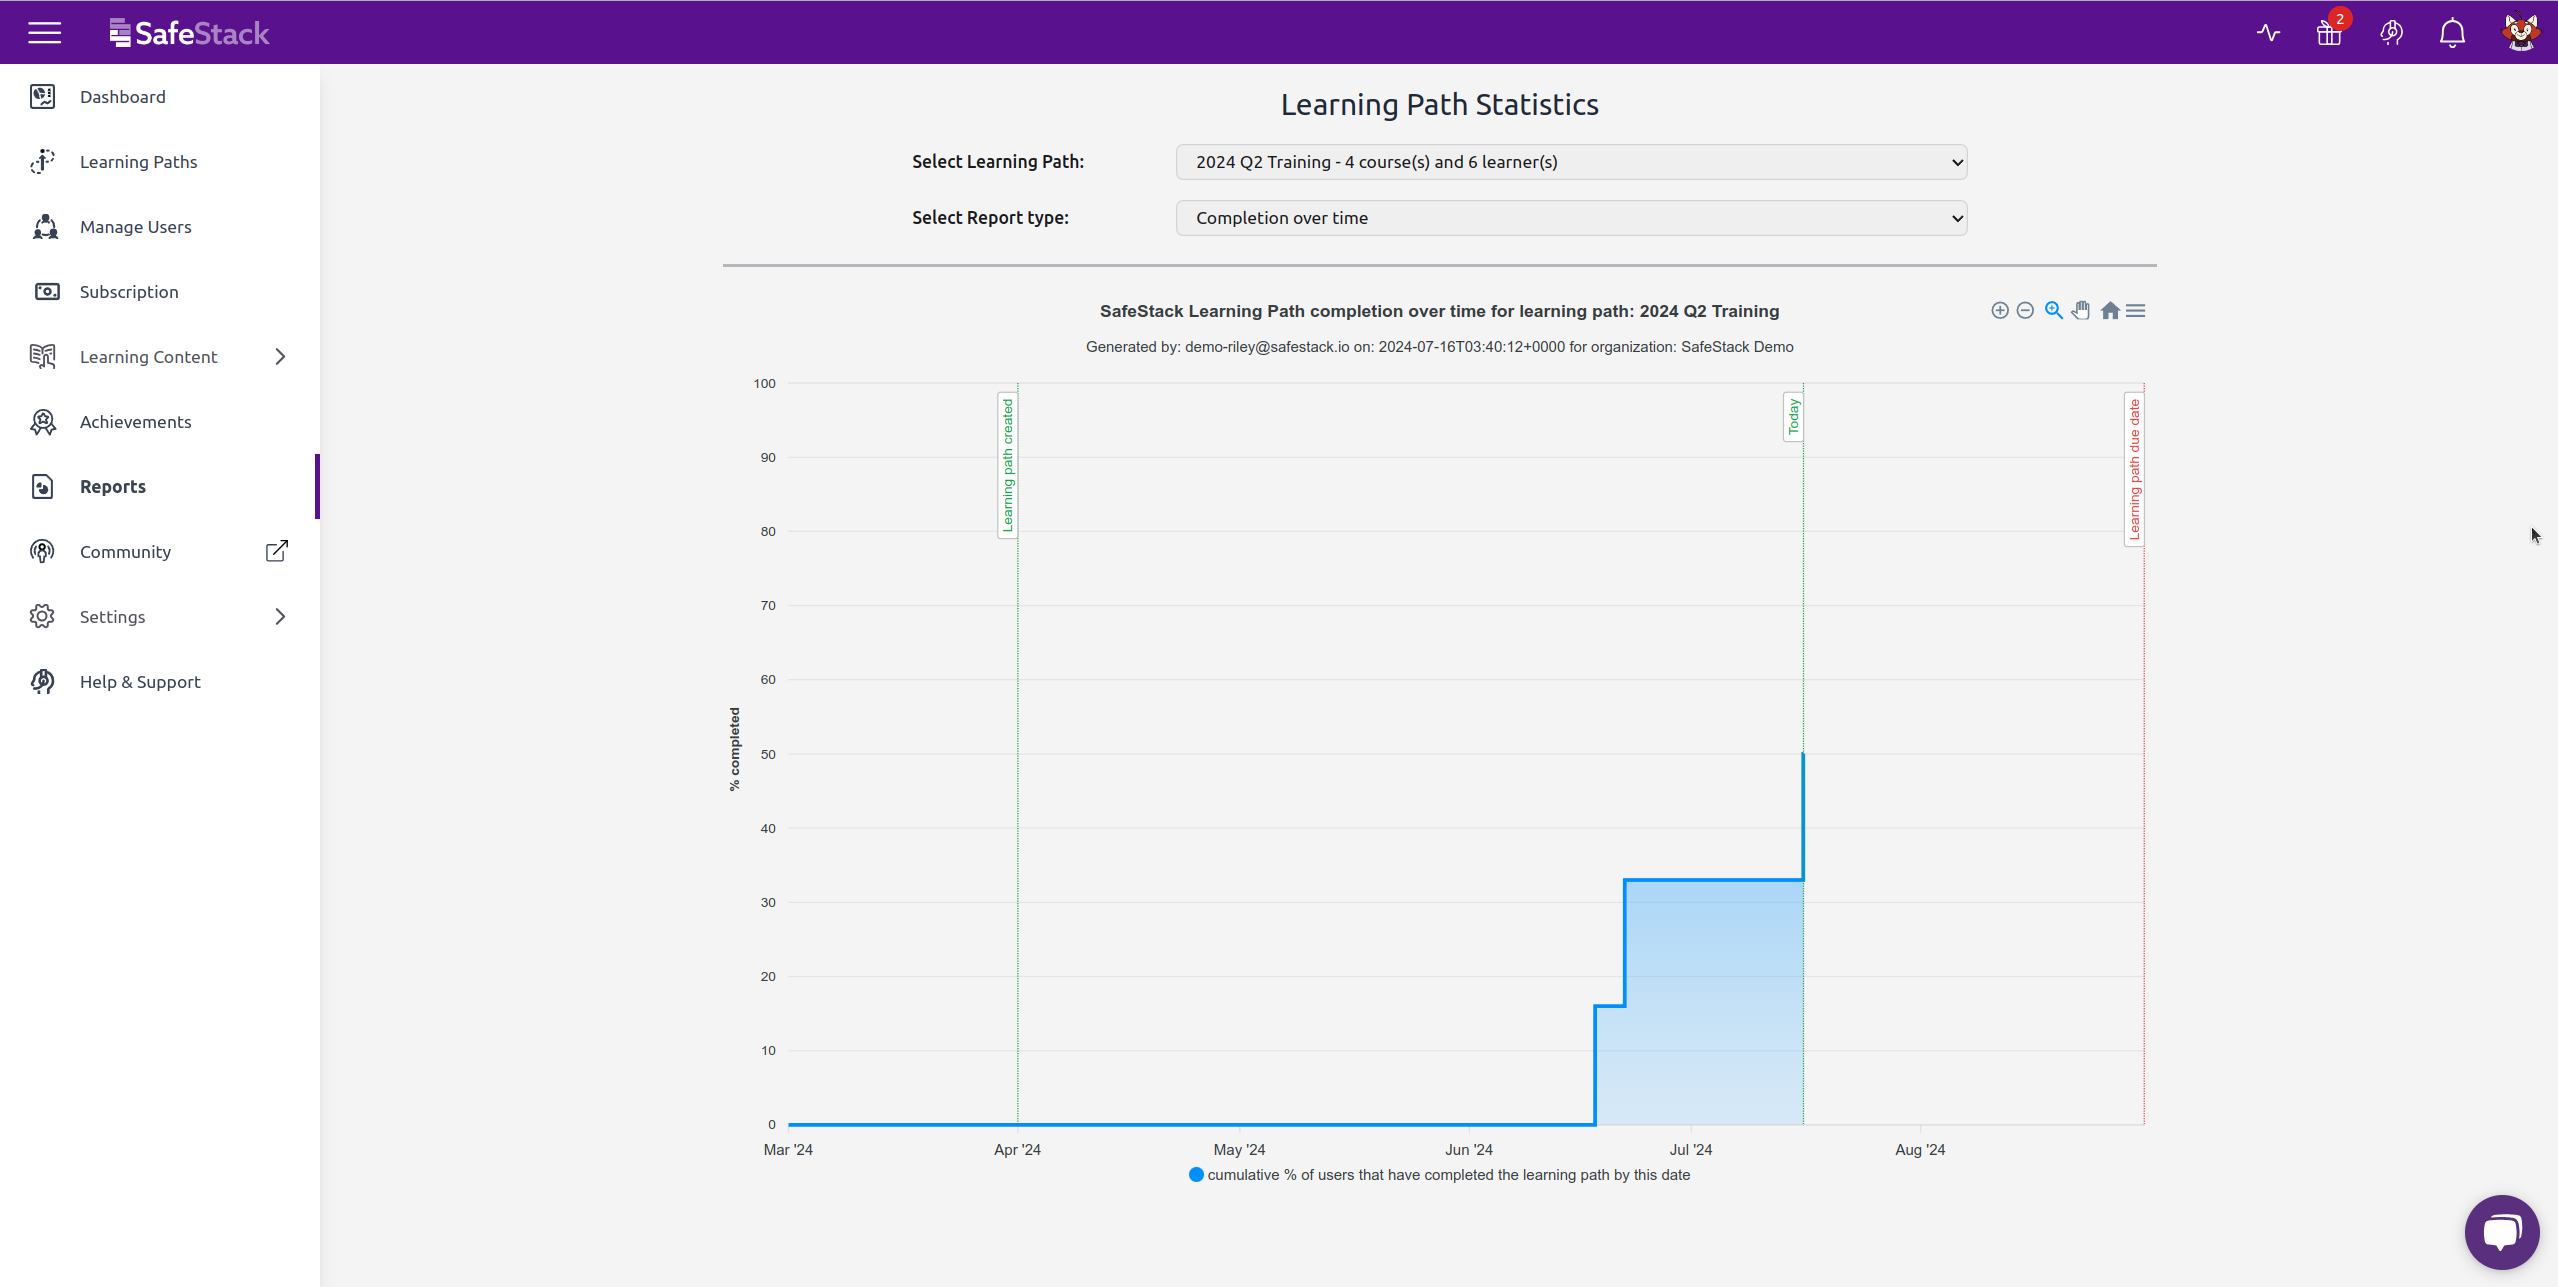
This graph plots the cumulative percentage of users that have completed the learning path, over time. This is really useful to understand how quickly your team is ramping up with their training and how much training there is still left to be done, before you hit the learning path due date (if there is one).
Other functionality
Graph toolbar
The graph toolbar (top right of every graph) can be used to download the graph in the PNG or SVG format. You can also download the raw data behind the graph, by downloading using the CSV format option.
For time series graphs (like the Learning Path completion over time graph), you can also zoom in/out or drag and select a specific time range you want to explore within the whole period.
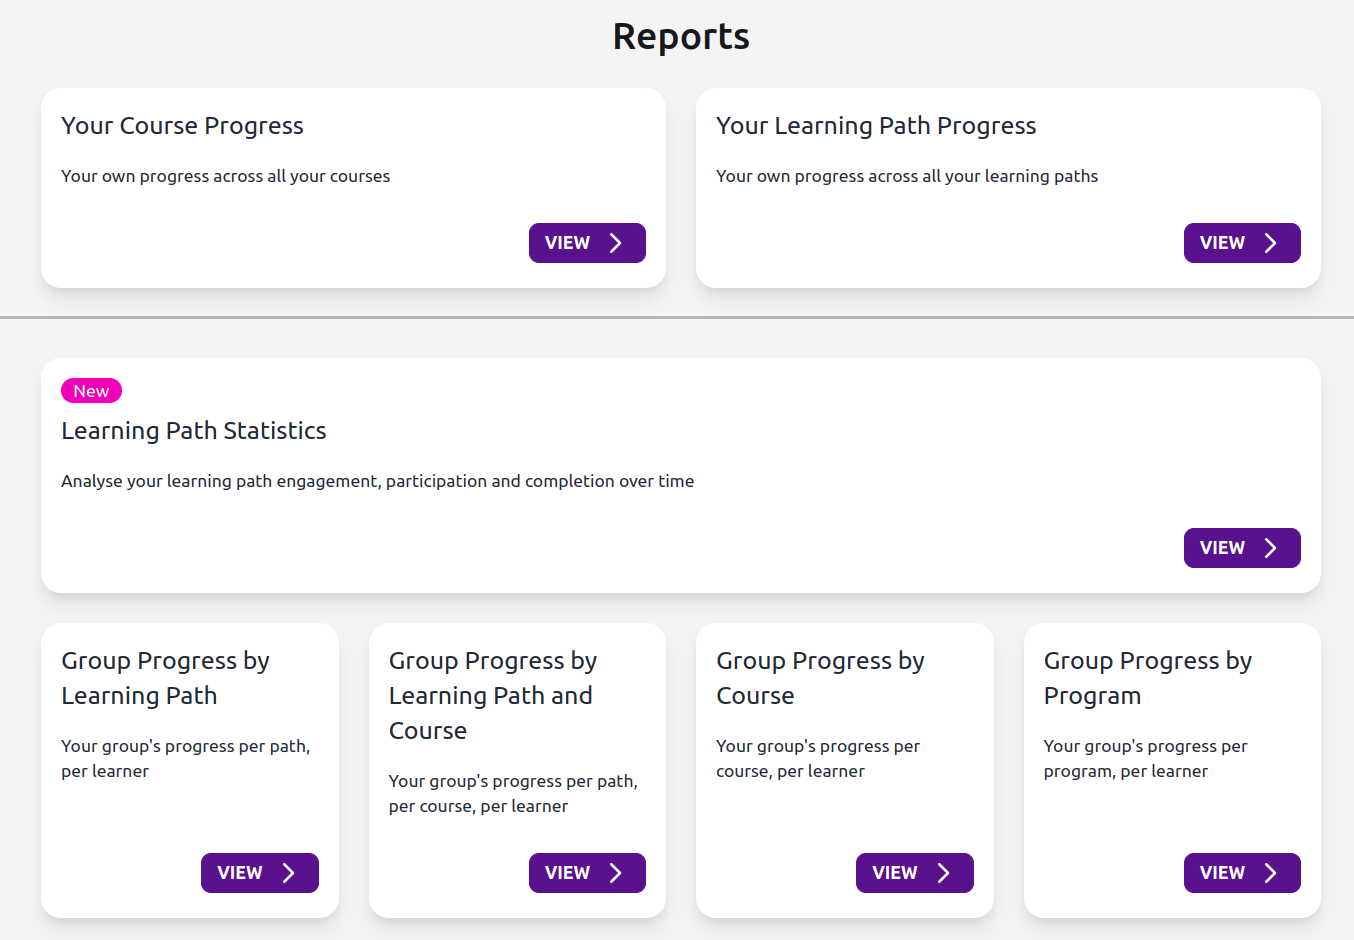
Reports page
We’ve made minor changes to the Reports page to separate individual reports from group reports much more clearly.
More interesting changes ahead
In the future, we plan to add more functionality to these reports to take them a step further, making it easy for group leaders to communicate with their learners about their training. But we will have more on that later!
We hope you enjoy the new changes in SafeStack and are always open to feedback, suggestions or concerns.
]]>More than 30 seminars have occurred since SafeStack was launched, covering a wide range of topics, including threat modeling, AI, DevOps, SAST and so on. Every topic is sourced from our community and customer suggestions, so they are guaranteed to be timely, relevant, and focused on current and emerging secure development best practices.
A feature requested by many customers is the ability to add seminars into learning paths, allowing security champions to craft outcome focused training programs, along with high quality, interactive, bite-sized training for specific topics covered in our seminars.
From today, all our past seminars are available as courses on the platform! They can be added to learning paths, just like any other course. Further, reports will indicate whether a learner has completed watching a seminar or not, from this point onwards, providing much more visibility about seminar related training to group leaders.
We will continue to host live seminars based on customer suggestions and our roadmap. You will still be able to register for live seminar sessions from the platform. Once a live seminar has finished, it will be available as a course on the platform, so that your team can watch it at a later date.
Our support team is available via email at [email protected] to answer any questions you may have about this change.
]]>We’ve introduced the ability for learners to mark a lesson in the Secure Development program as complete, which group leaders can opt-into from the Organization section under the Settings menu.
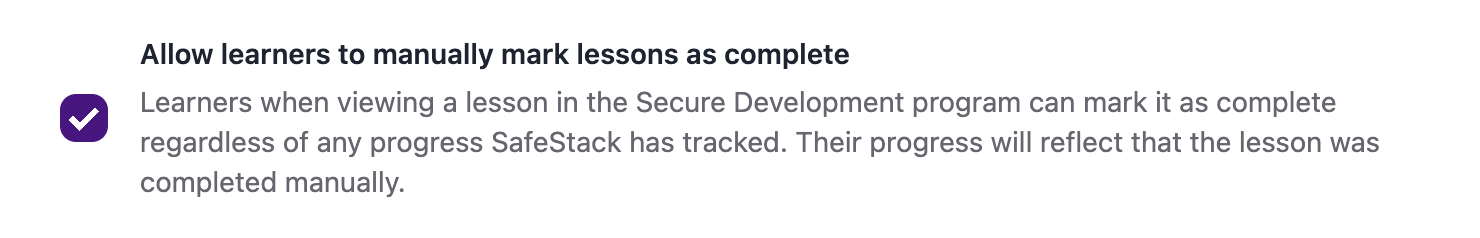
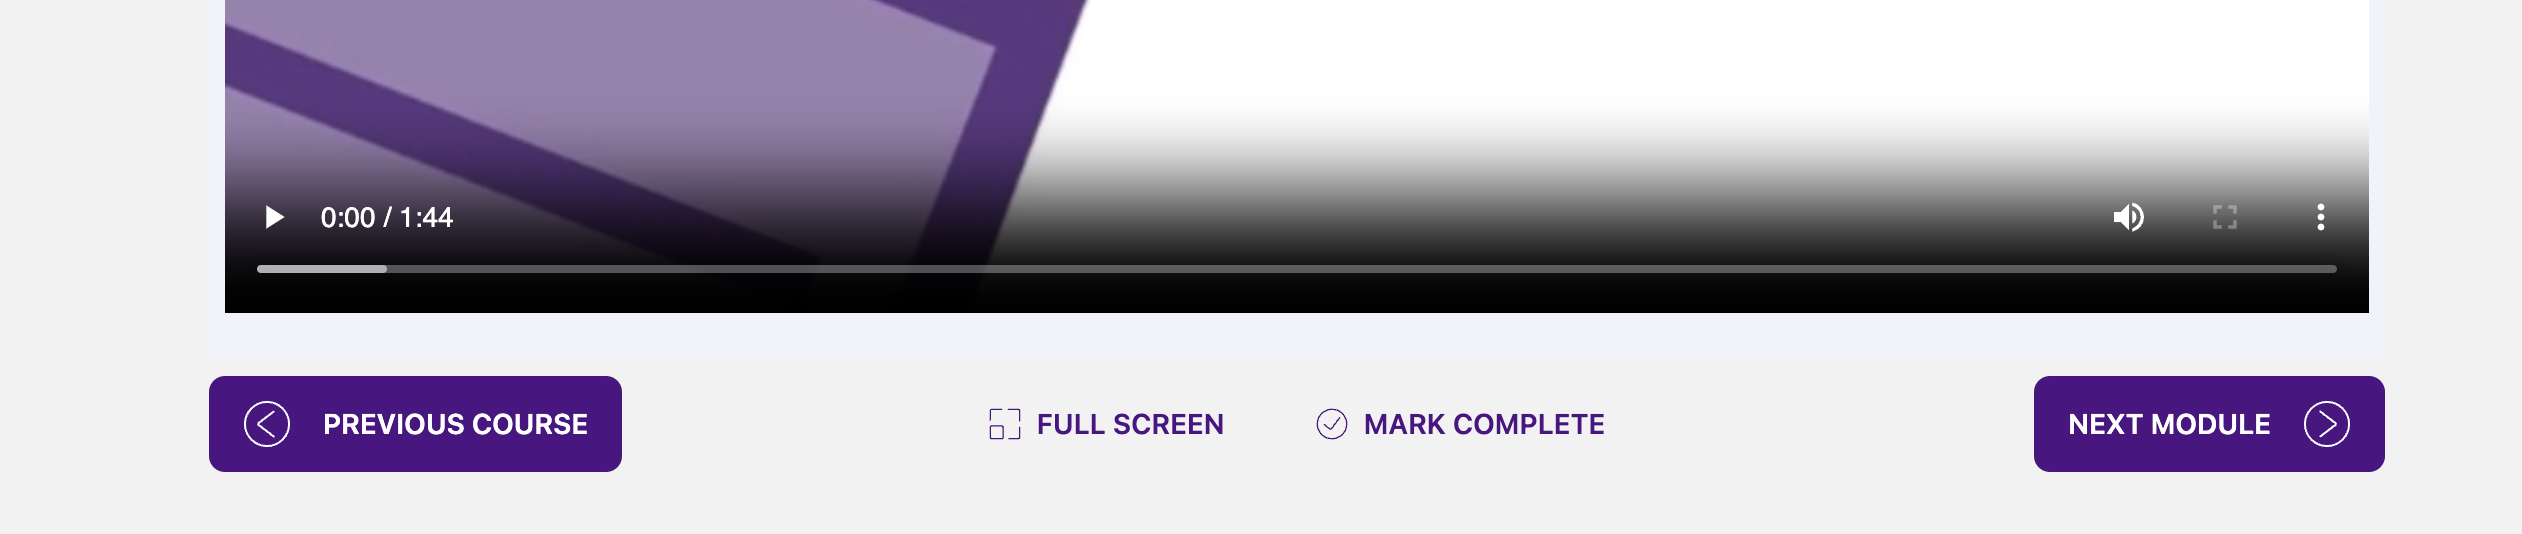
Turning this option on will show a Mark as Complete button alongside the player controls when a learner is watching a lesson. Learners are asked to confirm their decision, warning them that their lesson progress will reflect that it was manually completed.
We’ve now added the ability to set the due time that courses should be completed by, and improved how the due date is shown to group leaders and their learners based on their current timezone.
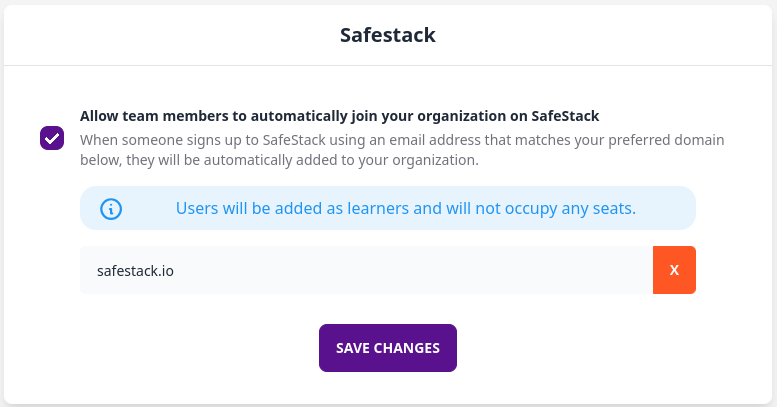
]]>Within this page you’ll find a handy new option to ensure that users from your organization, signing up to SafeStack on their own, get added to your existing SafeStack organization, instead of being added to a completely new SafeStack organization.
Note that such users will be invited as Learners into your SafeStack organization and will not occupy any seats, until a Group Leader assigns them to one of our training programs.
Learners can opt-out of email notifications from their Profile page.
]]>All our reports now support server side pagination, loading chunks of data as requested by your browser - while you “page” through the reports. This leads to much quicker report generation, especially for some of our larger customers with thousands of learners in their team.
All our reports now also provide enhanced filtering capabilities that help determine exactly how much progress you, or your team, have achieved, across a program, learning path or course.
For group leaders, this helps answer questions like:
“Who has not yet completed their Secure Development learning path?”
“How much progress, in % format, has my team, or user X, achieved in the Secure Development learning path?”
“Which users have completed the Designing Secure Microservice Architectures course, and which users have made some progress in that course?”
For learners, this helps answer questions like
“What learning paths have I made some progress in?”
“What courses have I made no progress in?”
Further, your currently selected report filters are now applied automatically whenever you download a report as a CSV file.
We hope that our enhanced reporting functionality helps you track your, or your teams progress, much more easily and are always open to feedback.
]]>On the Achievements page, you can now see all the Credly badges that you can earn by completing courses from our Secure Development programme.
The badges you have earned will be colorfully highlighted. You can even click into such a badge and view, accept, verify or share it directly from Credly.
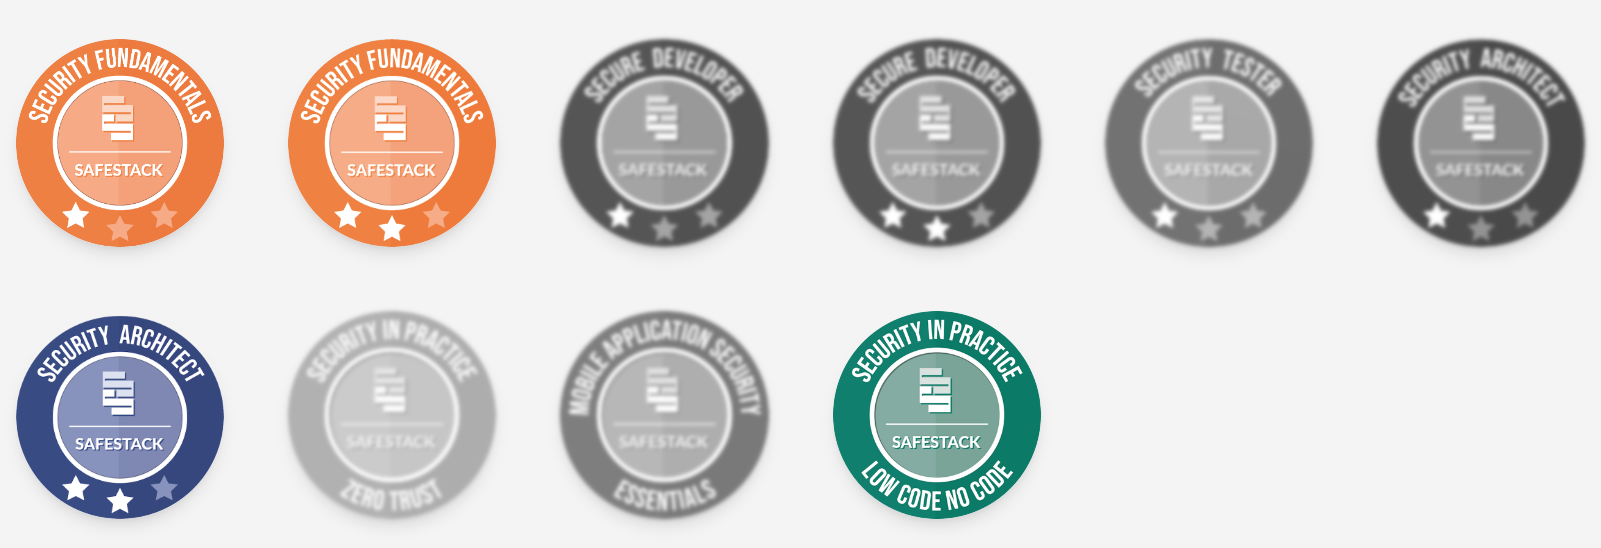
Go ahead and get some badges from our Achievements page!
]]>